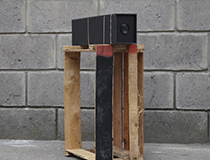
Exploración sobre cómo crear una experiencia con los datos del estudio forense. El reto era construir un dispositivo de proyección de datos para ser usado en la noche en espacio […]
Leave behind the old digital technology. Explore new and simple ways to represent information and make any kind of graphics quickly.
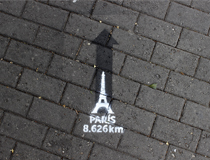
How far is…
¿A qué distancia están los lugares que soñamos conocer? En este proyecto combinamos la idea del Easter Egg con intervenciones en espacio público. Esperábamos que los ciudadanos se encontraran con […]
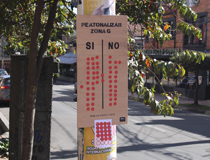
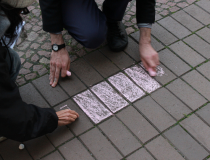
Dispositivo puntos
Estos dispositivos de recolección de datos fueron instalados en diferentes lugares de la ciudad para medir la percepción de los habitantes del barrio Chapinero sobre el proyecto de peatonalización de […]
Berlin #HMVTK workshop
Berlin #HMVTK workshop It is a very interesting city different to all other in Europe. Is rich in culture, people always look for new trends, this generates many spaces that […]
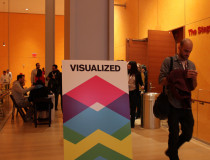
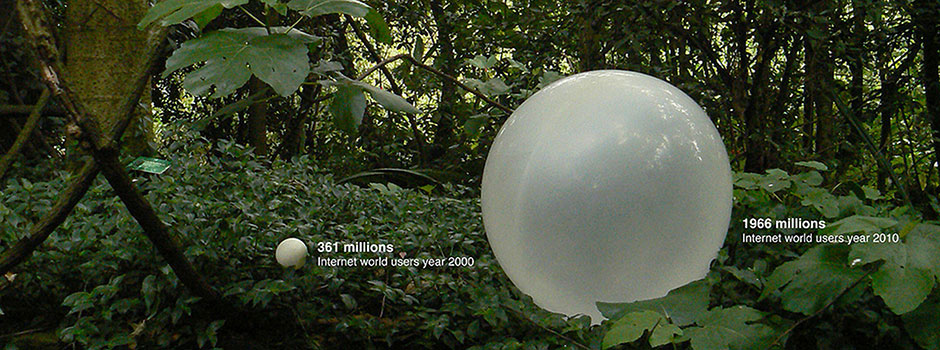
Visualized 2012: A few physical visualization examples
VISUALIZED explores the evolution of communication at the intersection of data, storytelling and design. Join us for an inspiring two-day gathering with the brightest minds and social innovators from around […]
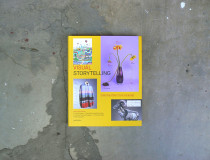
The #hmvtk published in Visual Storytelling by Gestalten
The handmade visualization toolkit #HMVTK was published in the Visual Storytelling book by Gestalten. Visual Storytelling uses graphic design, infographics, illustration, and photography to convey information in the most elegant, […]