
Barometer Dataviz Kit: Playing in community to spark conversations about data openness in neighborhoods
We designed a workshop using a kit to visualize and share in community the data from the latest Global Data Barometer report
At EasyDataViz, we believe that data shouldn't just be seen — it should be understood, shared, and activated. That's why we developed a data visualization kit based on the results of the second edition of the Global Data Barometer. Our goal is to transform the act of visualizing data into a playful and participatory experience that sparks reflection, conversation, and collective action.
This project is part of our participation in the Global Data Barometer’s Data Visualization Challenge.

A kit to play with data
The Barometer Kit is a tool designed to trigger an analog and participatory experience that makes the Global Data Barometer’s findings more accessible. It’s made for use in community spaces, allowing people in local neighborhoods to interact with key indicators on data openness, capabilities, rights, and use (all sourced from the Global Data Barometer).
The kit becomes a catalyst for sharing relevant data with the community, while also serving as an exercise in data literacy and visualization.
An analog and playful approach
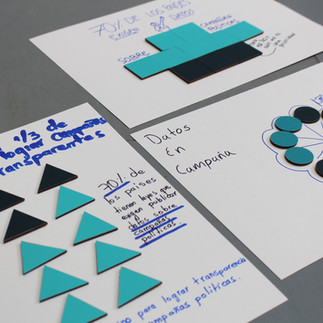
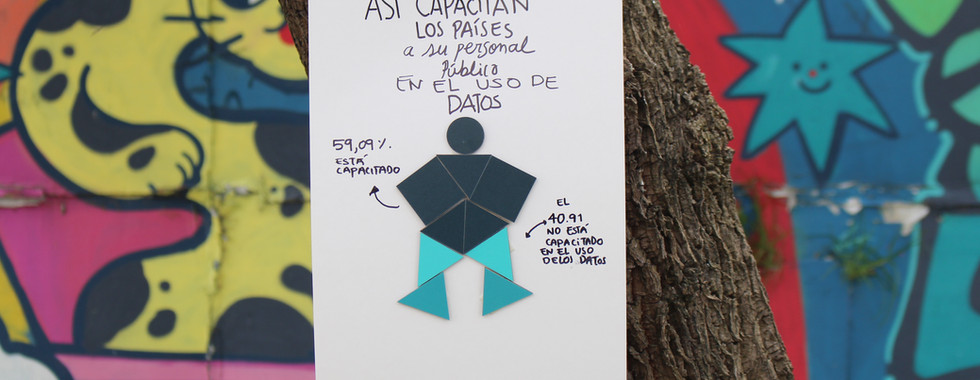
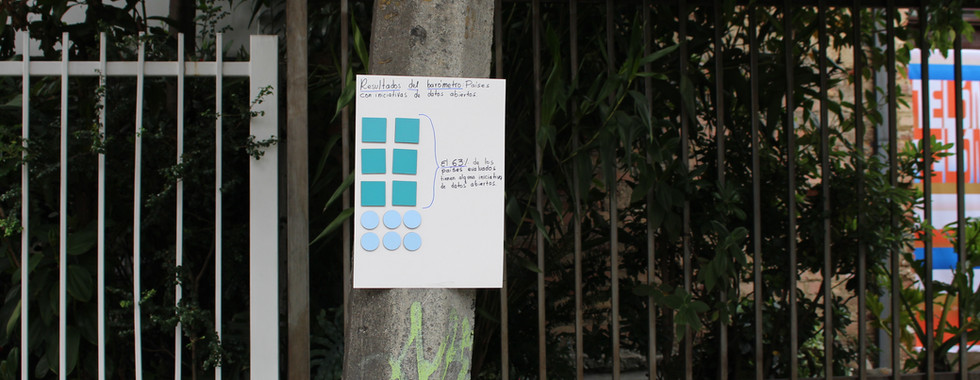
The kit is a box full of simple geometric tokens (circles, triangles, and squares) in various sizes and colors. These basic shapes help us focus on what truly matters: making data visible — not just through visualization, but through real engagement. The goal is for people to connect with the data, talk about it, and take action.
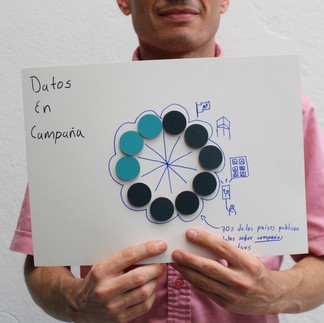
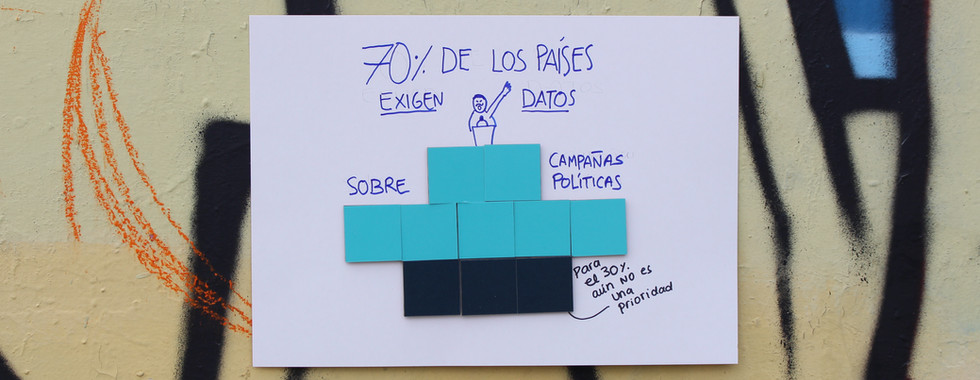
Using the kit in community settingsWe brought together neighbors from different communities and gave them a challenge: in just 10 minutes, visualize a specific data point from a card using the kit's elements. Once they created their visual, they took it out into their neighborhood to share it with others and raise awareness about the data and what it reveals about our region.


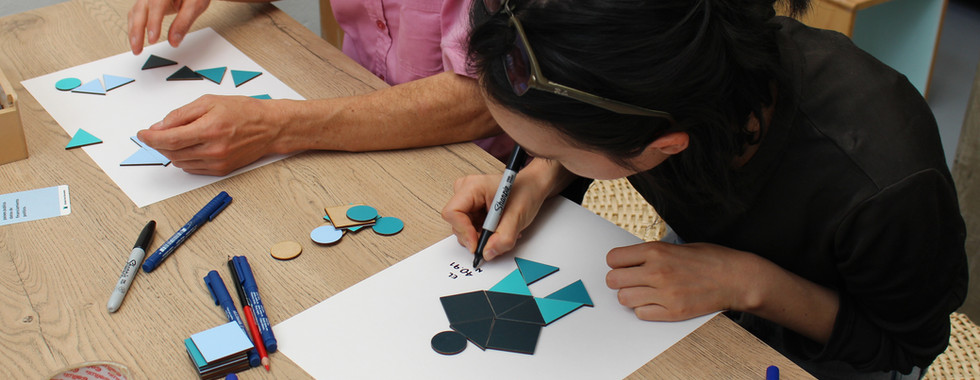


Using the kit in comunity settings
We brought together neighbors from different communities and gave them a challenge: in just 10 minutes, visualize a specific data point from a card using the kit's elements. Once they created their visual, they took it out into their neighborhood to share it with others and raise awareness about the data and what it reveals about our region.


Why the Global Data Barometer
Because the GDB offers a critical and up-to-date snapshot of the global data ecosystem. At EasyDataViz, we want this knowledge to go beyond reports — we want it to reach neighborhoods and communities. Through our workshops, we aim to turn data into tools for dialogue, education, and empowerment.
What´s next?
We’ll continue to activate the kit in various spaces — especially in contexts where conversations about data are just beginning. Our belief is simple: data alone won’t change the world — but it can when it brings us together to reflect, converse, and act.


"Jugar con los datos nos permitió primero conocerlos y luego comprenderlos mejor para compartirlos con la comunidad"
Participante
Nuestro Alcance
420
Piezas kit
24
Retos de datos
6
Talleres realizados


